Bitcoin Rainbow Chart is warning BTC could crash below $60,000 in November
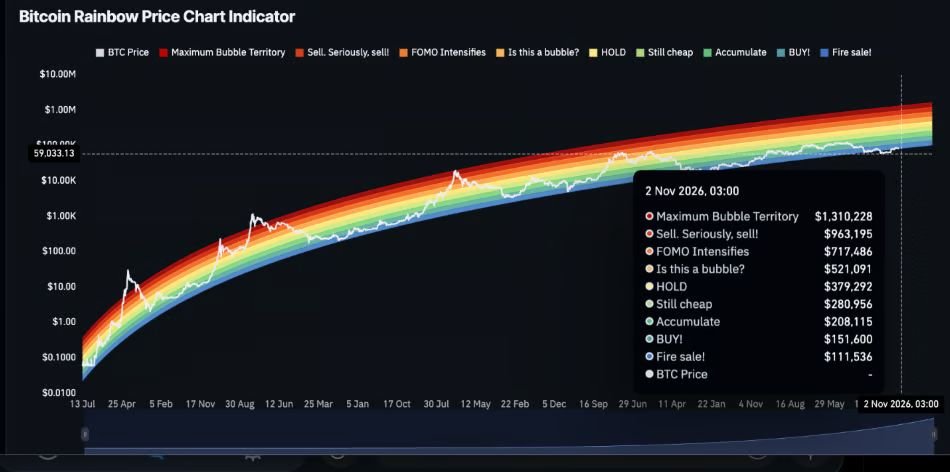
Photo: Finbold
The Bitcoin Rainbow Chart points to a potential 27% correction toward $59,000 in early November as the cryptocurrency struggles to recover above $82,000. At its press-time price of $81,703, BTC would need to lose about $22,670 to reach $59,033, according to the Coinglass Bitcoin Rainbow Chart. The indicator uses a logarithmic growth curve and nine color-coded valuation zones to assess Bitcoin’s price against its historical trend. For November 2, 2026, the blue Fire Sale! zone stands at $111,536, indicating extreme undervaluation relative to the model’s trend. The BUY!
Source: Finbold