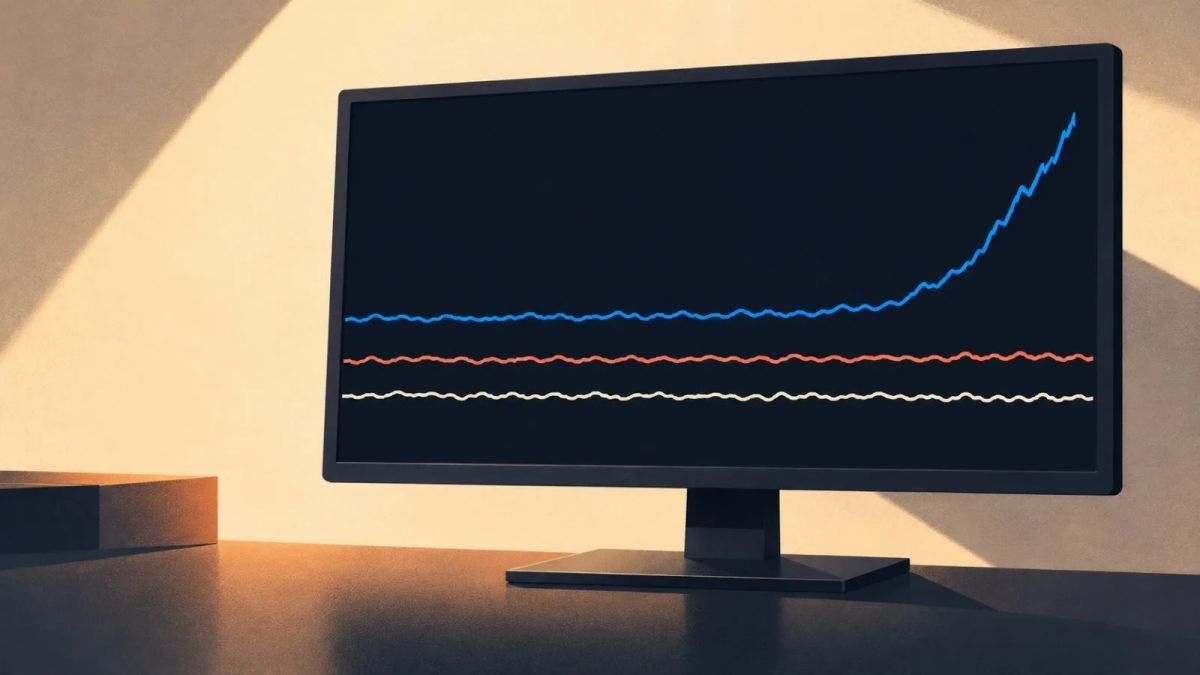
XRP: Google Trends Reveal Shocking Shift in Retail Interest
Photo: Coindoo
The XRP/USD daily chart showed price at $1.3082 on October 17 at 06:46 UTC. Its low of $1.30 left XRP above the $1.26-$1.279 range, where two longer-term moving averages meet a Fibonacci retracement. The chart has changed in a specific way: $1.34 has shifted from support to resistance. XRP can bounce from the lower range, but it must reclaim $1.34 before that bounce begins to repair the breakdown. XRP has given up the midpoint of its prior rally XRP’s latest decline follows a failed attempt to sustain a recovery above $1.34.
Source: Coindoo