Kaspa Price Could Be Setting Up for a Bigger Drop!
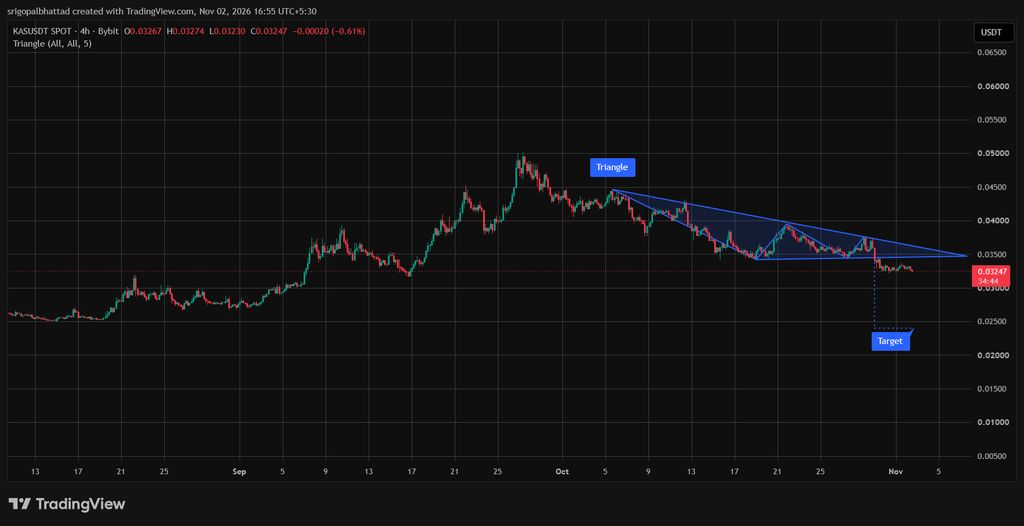
Photo: CaptainAltcoin
Kaspa spent most of October squeezed inside a narrowing pattern, and the way that squeeze ended matters more than the pattern itself. A fresh chart from an analyst on X shows where KAS trades now and where the next major level could appear. The daily indicators add a few more clues worth checking. Crypto With Gopal shared a KASUSDT spot chart from Bybit on the 4H timeframe, drawn on TradingView on Nov 2, 2026. The chart marks a triangle that starts near $0.0445 in early October.
Source: CaptainAltcoin